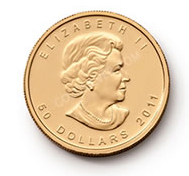
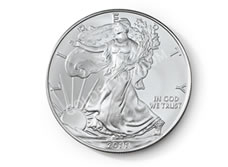
Welcome back to the Worldwide Fiat Currency Race to Debase!
GoldSilver.com
OCTOBER 03, 2011
OCTOBER 03, 2011
Rounding out the third quarter of 2011 heading to the finish line for the year, we are again tracking the performance of gold and silver bullion versus 75 different dying fiat currencies around the world.
Through the 3rd quarter of 2011 gold appears to be running away with another annual victory in value!
Thus far in 2011, gold has appreciated 17.2% versus 75 fiat currencies from around the world.
Kenyan Schillings, South African Rands, and Turkey Lira have been the biggest losers to gold thus far in 2011, down over 42%, 38%, and 37% respectively to the yellow metal's value.
| Currency vs 1 oz Gold | 1-Jan-11 | 30-Sep-11 | % Gold + / - Q3 2011 |
| Afghanistan Afghanis | 61,158 | 78,334 | 28.1% |
| Albania Leke | 148,940 | 168,907 | 13.4% |
| Algeria Dinars | 104,548 | 121,100 | 15.8% |
| Argentina Pesos | 5,642 | 6,819 | 20.9% |
| Australia Dollars | 1,389 | 1,663 | 19.8% |
| Bahamas Dollars | 1,421 | 1,621 | 14.1% |
| Bahrain Dinars | 536 | 611 | 14.0% |
| Bangladesh Taka | 100,212 | 121,789 | 21.5% |
| Barbados Dollars | 2,843 | 3,242 | 14.0% |
| Bermuda Dollars | 1,421 | 1,621 | 14.1% |
| Brazil Reais | 2,359 | 3,004 | 27.3% |
| Bulgaria Leva | 2,081 | 2,358 | 13.3% |
| CFA BEAC Francs | 696,322 | 791,051 | 13.6% |
| Canada Dollars | 1,418 | 1,684 | 18.8% |
| Chile Pesos | 664,883 | 846,118 | 27.3% |
| China Yuan Renminbi | 9,369 | 10,348 | 10.4% |
| Colombia Pesos | 2,722,077 | 3,119,868 | 14.6% |
| Comptoirs Français Francs | 126,675 | 143,908 | 13.6% |
| Currency vs 1 oz Gold | 1-Jan-11 | 30-Sep-11 | % Gold + / - Q3 2011 |
| Costa Rica Colones | 715,132 | 824,665 | 15.3% |
| Croatia Kuna | 7,844 | 9,041 | 15.3% |
| Czech Republic Koruny | 26,558 | 29,783 | 12.1% |
| Denmark Kroner | 7,913 | 8,974 | 13.4% |
| Dominican Republic Pesos | 52,878 | 61,845 | 17.0% |
| East Caribbean Dollars | 3,838 | 4,377 | 14.0% |
| Egypt Pounds | 8,252 | 9,673 | 17.2% |
| Euro | 1,062 | 1,206 | 13.6% |
| Fiji Dollars | 2,632 | 2,991 | 13.6% |
| Hong Kong Dollars | 11,049 | 12,620 | 14.2% |
| Hungary Forint | 295,818 | 353,038 | 19.3% |
| IMF Special Drawing Rights | 923 | 1,038 | 12.5% |
| Iceland Kronur | 163,538 | 191,474 | 17.1% |
| India Rupees | 63,539 | 79,566 | 25.2% |
| Indonesia Rupiahs | 12,793,050 | 14,241,724 | 11.3% |
| Iran Rials | 14,645,199 | 17,419,182 | 18.9% |
| Iraq Dinars | 1,658,832 | 1,894,325 | 14.2% |
| Israel New Shekels | 5,043 | 6,069 | 20.3% |
| Jamaica Dollars | 120,397 | 139,007 | 15.5% |
| Currency vs 1 oz Gold | 1-Jan-11 | 30-Sep-11 | % Gold + / - Q3 2011 |
| Japan Yen | 115,351 | 124,882 | 8.3% |
| Jordan Dinars | 1,006 | 1,149 | 14.2% |
| Kenya Shillings | 114,427 | 162,592 | 42.1% |
| Kuwait Dinars | 400 | 449 | 12.1% |
| Lebanon Pounds | 2,132,175 | 2,437,455 | 14.3% |
| Malaysia Ringgits | 4,384 | 5,175 | 18.1% |
| Mauritius Rupees | 42,359 | 47,007 | 11.0% |
| Mexico Pesos | 17,571 | 22,324 | 27.0% |
| Morocco Dirhams | 11,842 | 13,494 | 14.0% |
| New Zealand Dollars | 1,821 | 2,113 | 16.0% |
| Norway Kroner | 8,273 | 9,469 | 14.5% |
| Oman Rials | 547 | 623 | 13.9% |
| Pakistan Rupees | 121,690 | 141,862 | 16.6% |
| Peru Nuevos Soles | 3,987 | 4,495 | 12.7% |
| Philippines Pesos | 62,032 | 70,957 | 14.4% |
| Poland Zlotych | 4,209 | 5,321 | 26.4% |
| Qatar Riyals | 5,175 | 5,903 | 14.1% |
| Romania New Lei | 4,541 | 5,249 | 15.6% |
| Russia Rubles | 43,322 | 52,183 | 20.5% |
| Currency vs 1 oz Gold | 1-Jan-11 | 30-Sep-11 | % Gold + / - Q3 2011 |
| Saudi Arabia Riyals | 5,331 | 6,080 | 14.1% |
| Singapore Dollars | 1,826 | 2,110 | 15.5% |
| South Africa Rand | 9,424 | 13,004 | 38.0% |
| South Korea Won | 1,592,877 | 1,914,735 | 20.2% |
| Sri Lanka Rupees | 157,696 | 178,602 | 13.3% |
| Sudan Pounds | 3,551 | 4,339 | 22.2% |
| Sweden Kronor | 9,554 | 11,062 | 15.8% |
| Switzerland Francs | 1,328 | 1,468 | 10.5% |
| Taiwan New Dollars | 41,421 | 49,452 | 19.4% |
| Thailand Baht | 42,672 | 50,491 | 18.3% |
| Trinidad and Tobago Dollars | 9,012 | 10,375 | 15.1% |
| Tunisia Dinars | 1,992 | 2,322 | 16.6% |
| Turkey Lira | 2,185 | 3,007 | 37.6% |
| United Arab Emirates Dirhams | 5,221 | 5,955 | 14.1% |
| United Kingdom Pounds | 911 | 1,038 | 13.9% |
| United States Dollars | 1,421 | 1,621 | 14.1% |
| Venezuela Bolivares Fuertes | 6,112 | 6,971 | 14.1% |
| Vietnam Dong | 27,711,168 | 33,768,458 | 21.9% |
| Zambia Kwacha | 6,794,531 | 7,854,166 | 15.6% |
Welcome back to the Worldwide Fiat Currency Race to Debase!
Rounding out the third quarter of 2011 heading to the finish line for the year, we are again tracking the performance of gold and silver bullion versus 75 different dying fiat currencies around the world.
Silver has had a wild ride through the first three quarters in 2011, from having the lead in the first half of the race to recently faltering in search of its second wind.
Overall silver has still appreciated 0.55% versus 75 different fiat currencies globally.
Kenyan Schillings, South African Rands, and Turkey Lira have been the biggest losers to silver thus far in 2011, down 21.9%, 18.4%, and 18.0% respectively to the white metal's value.
| Currency vs 1 oz Silver | 1-Jan-11 | 30-Sep-11 | % Silver + / - Q3 2011 |
| Afghanistan Afghanis | 1,329.80 | 1,461.18 | 9.9% |
| Albania Leke | 3,238.49 | 3,150.66 | -2.7% |
| Algeria Dinars | 2,273.25 | 2,258.89 | -0.6% |
| Argentina Pesos | 122.67 | 127.20 | 3.7% |
| Australia Dollars | 30.21 | 31.03 | 2.7% |
| Bahamas Dollars | 30.91 | 30.24 | -2.2% |
| Bahrain Dinars | 11.65 | 11.40 | -2.2% |
| Bangladesh Taka | 2,178.98 | 2,271.75 | 4.3% |
| Barbados Dollars | 61.82 | 60.48 | -2.2% |
| Bermuda Dollars | 30.91 | 30.24 | -2.2% |
| Brazil Reais | 51.29 | 56.03 | 9.2% |
| Bulgaria Leva | 45.24 | 43.99 | -2.8% |
| CFA BEAC Francs | 15,140.58 | 14,755.62 | -2.5% |
| Canada Dollars | 30.84 | 31.42 | 1.9% |
| Chile Pesos | 14,456.98 | 15,782.79 | 9.2% |
| China Yuan Renminbi | 203.71 | 193.02 | -5.2% |
| Colombia Pesos | 59,187.86 | 58,195.44 | -1.7% |
| Comptoirs Français Francs | 2,754.37 | 2,684.34 | -2.5% |
| Currency vs 1 oz Silver | 1-Jan-11 | 30-Sep-11 | % Silver + / - Q3 2011 |
| Costa Rica Colones | 15,549.56 | 15,382.63 | -1.1% |
| Croatia Kuna | 170.55 | 168.64 | -1.1% |
| Czech Republic Koruny | 577.46 | 555.55 | -3.8% |
| Denmark Kroner | 172.07 | 167.39 | -2.7% |
| Dominican Republic Pesos | 1,149.76 | 1,153.60 | 0.3% |
| East Caribbean Dollars | 83.45 | 81.65 | -2.2% |
| Egypt Pounds | 179.42 | 180.42 | 0.6% |
| Euro | 23.08 | 22.49 | -2.5% |
| Fiji Dollars | 57.24 | 55.79 | -2.5% |
| Hong Kong Dollars | 240.24 | 235.40 | -2.0% |
| Hungary Forint | 6,432.16 | 6,585.28 | 2.4% |
| IMF Special Drawing Rights | 20.07 | 19.36 | -3.5% |
| Iceland Kronur | 3,555.91 | 3,571.60 | 0.4% |
| India Rupees | 1,381.57 | 1,484.16 | 7.4% |
| Indonesia Rupiahs | 278,167.50 | 265,653.37 | -4.5% |
| Iran Rials | 318,439.97 | 324,923.04 | 2.0% |
| Iraq Dinars | 36,069.05 | 35,335.17 | -2.0% |
| Israel New Shekels | 109.66 | 113.20 | 3.2% |
| Jamaica Dollars | 2,617.87 | 2,592.92 | -1.0% |
| Currency vs 1 oz Silver | 1-Jan-11 | 30-Sep-11 | % Silver + / - Q3 2011 |
| Japan Yen | 2,508.14 | 2,329.44 | -7.1% |
| Jordan Dinars | 21.88 | 21.43 | -2.0% |
| Kenya Shillings | 2,488.05 | 3,032.86 | 21.9% |
| Kuwait Dinars | 8.69 | 8.37 | -3.7% |
| Lebanon Pounds | 46,361.25 | 45,466.28 | -1.9% |
| Malaysia Ringgits | 95.33 | 96.54 | 1.3% |
| Mauritius Rupees | 921.04 | 876.83 | -4.8% |
| Mexico Pesos | 382.05 | 416.41 | 9.0% |
| Morocco Dirhams | 257.48 | 251.71 | -2.2% |
| New Zealand Dollars | 39.60 | 39.41 | -0.5% |
| Norway Kroner | 179.88 | 176.63 | -1.8% |
| Oman Rials | 11.90 | 11.62 | -2.3% |
| Pakistan Rupees | 2,645.99 | 2,646.18 | 0.0% |
| Peru Nuevos Soles | 86.70 | 83.84 | -3.3% |
| Philippines Pesos | 1,348.80 | 1,323.57 | -1.9% |
| Poland Zlotych | 91.53 | 99.25 | 8.4% |
| Qatar Riyals | 112.53 | 110.12 | -2.1% |
| Romania New Lei | 98.74 | 97.92 | -0.8% |
| Russia Rubles | 941.98 | 973.38 | 3.3% |
| Currency vs 1 oz Silver | 1-Jan-11 | 30-Sep-11 | % Silver + / - Q3 2011 |
| Saudi Arabia Riyals | 115.91 | 113.41 | -2.2% |
| Singapore Dollars | 39.70 | 39.36 | -0.9% |
| South Africa Rand | 204.92 | 242.57 | 18.4% |
| South Korea Won | 34,634.94 | 35,715.88 | 3.1% |
| Sri Lanka Rupees | 3,428.88 | 3,331.49 | -2.8% |
| Sudan Pounds | 77.21 | 80.93 | 4.8% |
| Sweden Kronor | 207.74 | 206.35 | -0.7% |
| Switzerland Francs | 28.88 | 27.38 | -5.2% |
| Taiwan New Dollars | 900.64 | 922.45 | 2.4% |
| Thailand Baht | 927.84 | 941.82 | 1.5% |
| Trinidad and Tobago Dollars | 195.95 | 193.52 | -1.2% |
| Tunisia Dinars | 43.32 | 43.31 | 0.0% |
| Turkey Lira | 47.52 | 56.09 | 18.0% |
| United Arab Emirates Dirhams | 113.53 | 111.07 | -2.2% |
| United Kingdom Pounds | 19.80 | 19.36 | -2.2% |
| United States Dollars | 30.91 | 30.24 | -2.2% |
| Venezuela Bolivares Fuertes | 132.90 | 130.03 | -2.2% |
| Vietnam Dong | 602,541.71 | 629,888.94 | 4.5% |
| Zambia Kwacha | 147,737.85 | 146,505.13 | -0.8% |


No comments:
Post a Comment